Rate this article :
5/5 | 1 opinion
This article was useful to you ?
Yes
No
Vous avez noté 0 étoile(s)
Sommaire
Procédure
WordPress, the most popular CMS, is very frequently subject to performance problems. However, this CMS does not provide a native tool for analysing the bottlenecks that cause slowness, which does not make analysis any easier.
Query Monitor is a free WordPress plugin that provides the necessary profiling tools during the execution of each page generated by WordPress to identify the points to check when there are speed and performance problems.
While the usual method is to trial and error by deactivating each plugin until the problem disappears, Query Monitor takes a new approach by immediately identifying the plugin and/or theme causing a slow SQL or HTTP request.
In this guide, you'll learn everything you need to know to identify your performance problems with Query Monitor.
To install Query Monitor, go to the dashboard of your WordPress site and go to Extensions then Add.
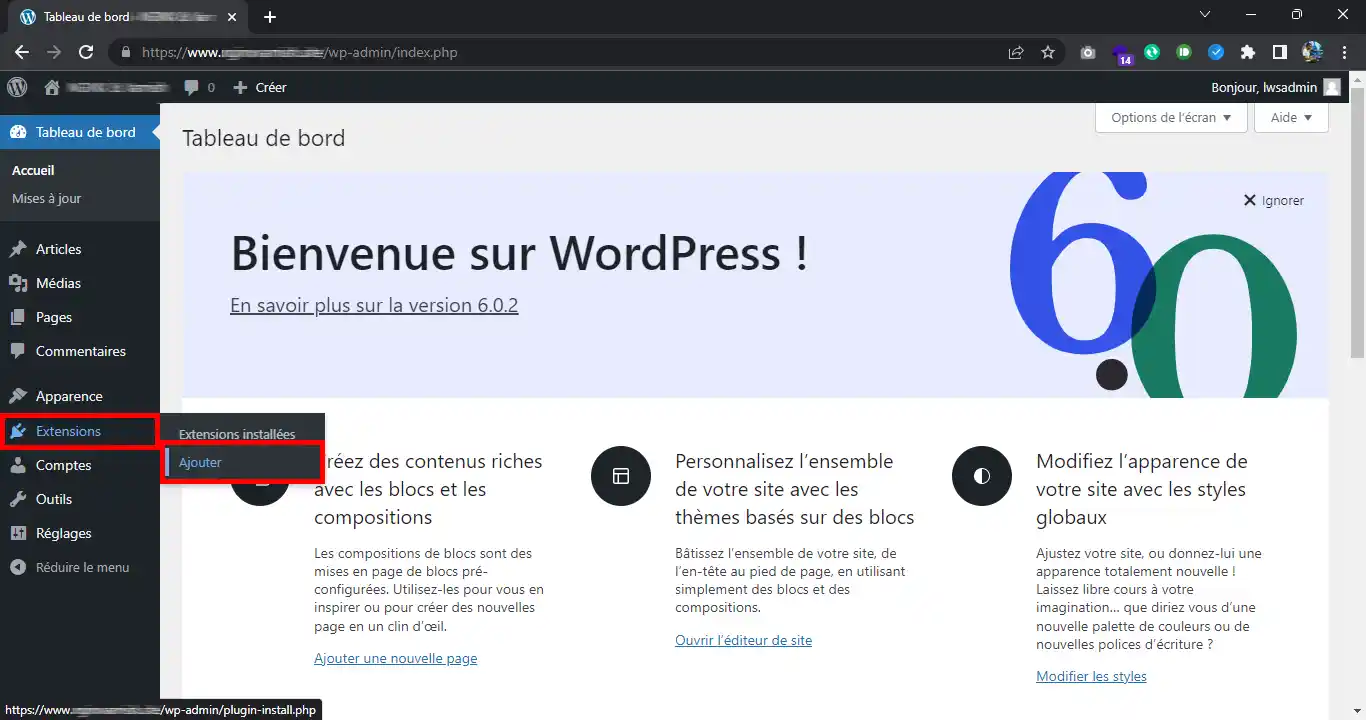
Search for the Query Monitor plugin and install it.
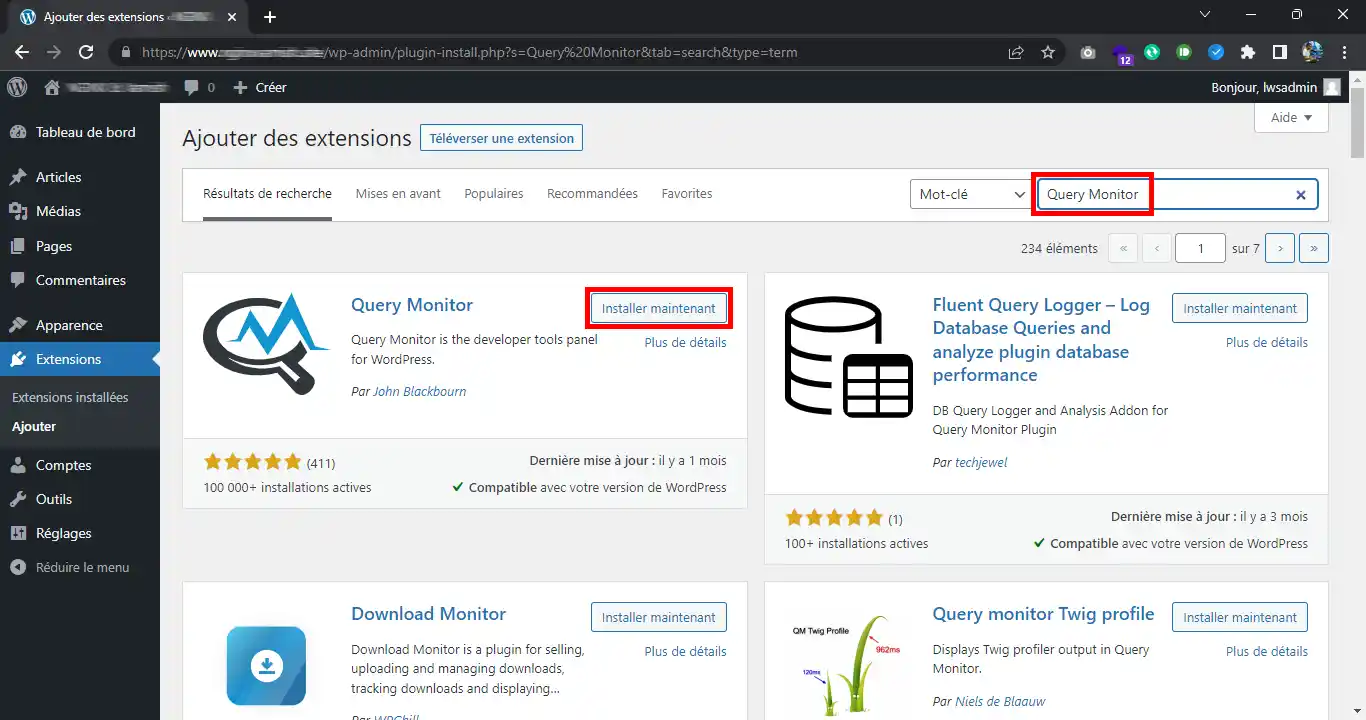
Once installed, activate the extension.
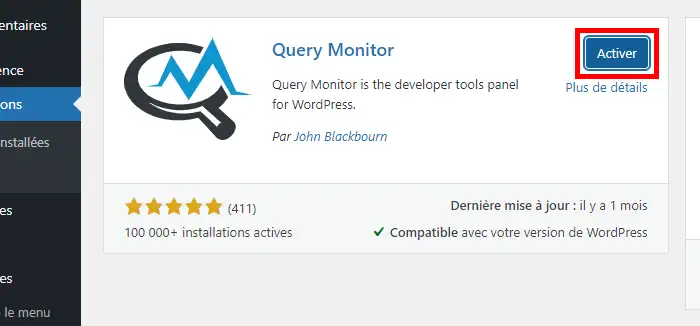
As soon as the plugin is active, a new menu appears on the WordPress menu bar. Clicking on the menu will display the debugging window:
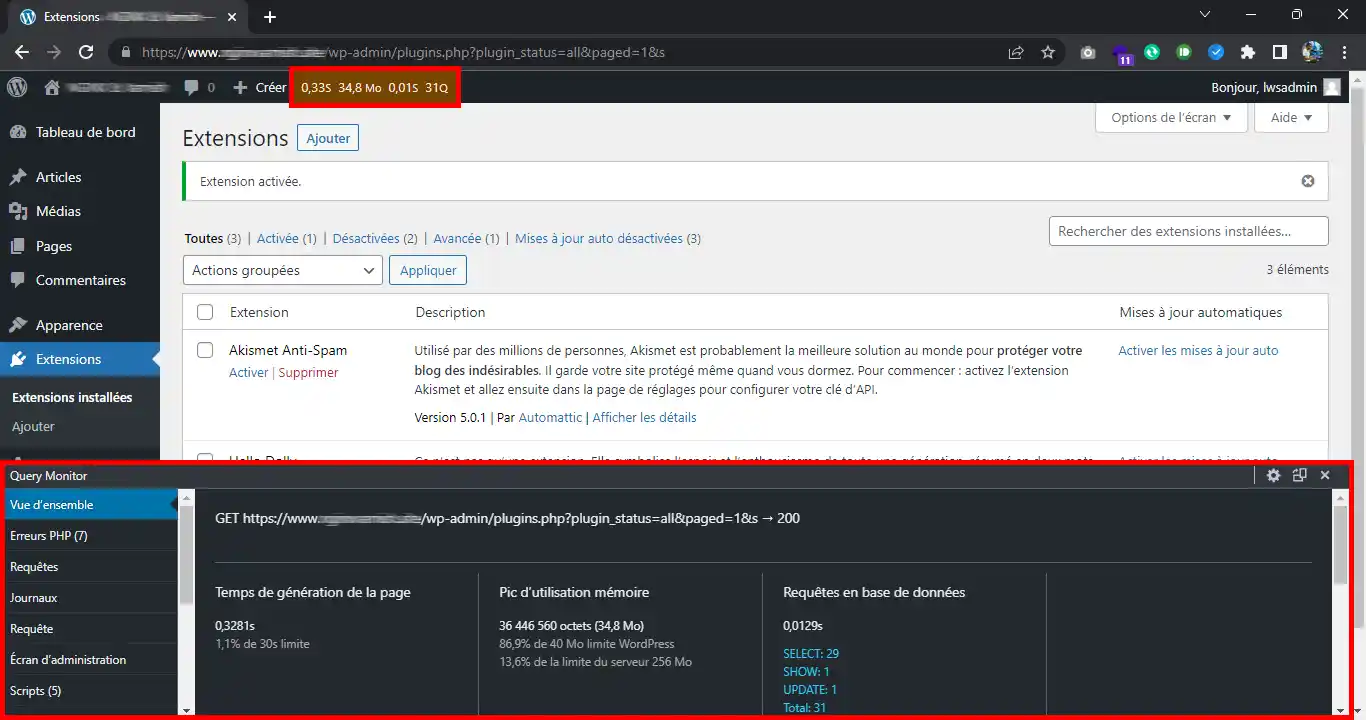
You will then need to go to the page where you are experiencing performance problems and click on the menu to see the details.
Don't forget to deactivate the Query Monitor plugin as soon as you've finished debugging, as generating this debugging data is itself quite cumbersome and can lead to performance problems.
The Query Monitor overview menu shows the URL currently open.
The page generation time is the time over which PHP executes the script. The limit mentioned below is the max_execution_time defined for PHP. In general, the page generation time should be approximately the same as the browser waiting time (visible from the developer console):
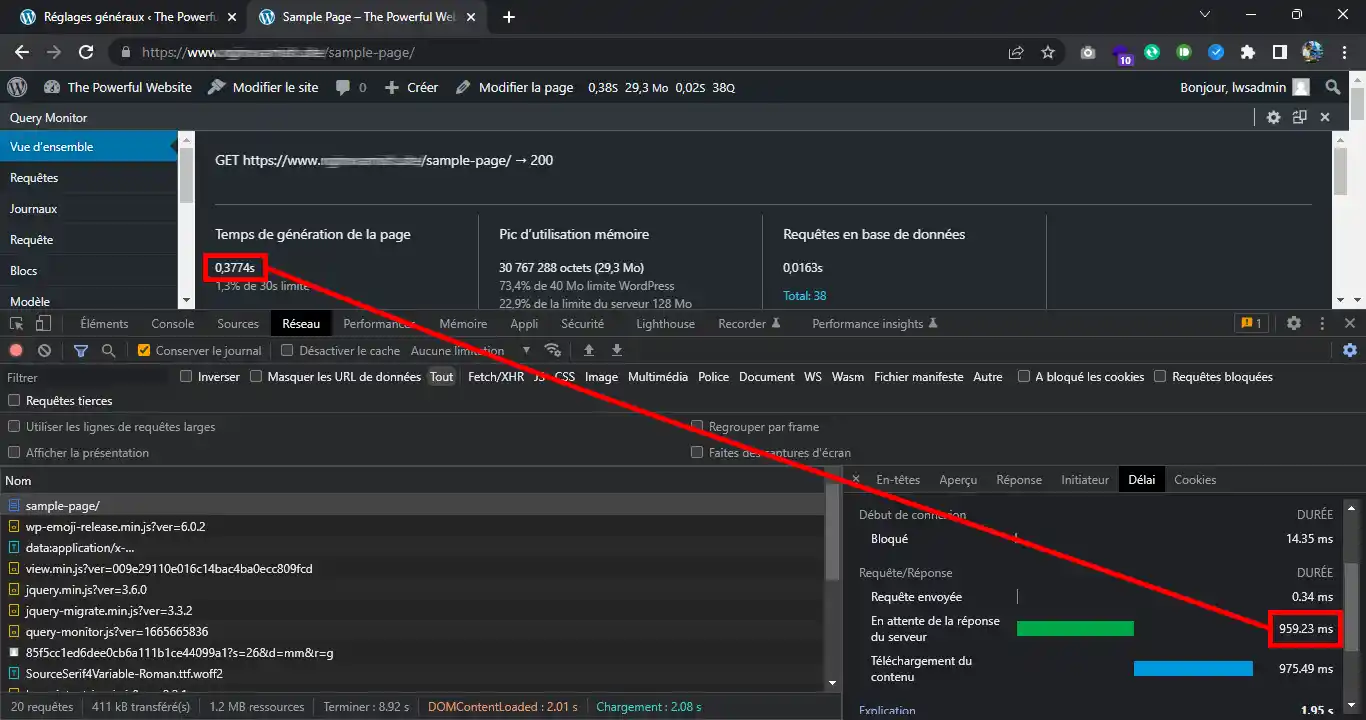
In this example, you can see that there is a problem: the page generation time is only 377 ms, but the browser takes up to 959 ms before it can receive the page. This problem occurs when the network between the web browser and the site server is slow. In such cases, it will be necessary to set up a server closer to the client using Ipxchange or Cloudflare.
The"Peak memory usage" section indicates the maximum memory consumption of your website when generating the page. The WordPress limit is defined by the WP_MEMORY_LIMIT constant in wp-config.php, while the server limit is defined by the memory_limit value set from the cPanel interface.
The next section,"Database queries", shows the time spent retrieving information from the database.
The"HTTP API Calls" section shows the HTTP requests made by the site during page generation to access external APIs. The response time of an API will inevitably depend on the server on which the API is hosted.
The last two sections,"Object cache" and"Opcode cache" indicate the state of use of these two caches. It should be remembered that the object cache stores WordPress objects in memory to reduce the number of MySQL requests made to the database and thus optimise response time, while the Opcode cache allows PHP not to recompile the PHP file each time. Once a PHP file has been executed for the first time, the Opcode cache stores the PHP file's Opcode (the compiled, binary version of the PHP file) for future execution.

If you'd like to find out more about the challenges of object caching, we recommend that you read our documentation dedicated to setting up a persistent object cache with Redis.

This menu displays the PHP errors encountered by WordPress (not necessarily fatal and/or blocking errors). They are often hidden and difficult to find without modifying the PHP error reporting thresholds. However, Query Monitor allows you to view them quickly without modifying any configuration. The"Component" column shows you the origin of the script causing the error, whether it comes from the WordPress core, a theme or a particular plugin. The"Location" column shows the file and its line number.
If you encounter PHP errors, even if they are not blocking, your performance could be affected. If you have a lot of errors to log, your PHP process will have to open, write and close the PHP log file on each new visit. If you have deprecations, adjust the PHP error reporting thresholds so that they are not included in the log files to avoid unnecessary writes to the PHP log file if you cannot resolve them properly at the moment.
This menu groups together the SQL queries performed by WordPress, as well as the components behind the queries and their execution times:

If you notice particularly slow queries :
The "HTTP API Calls" menu, a little further down the list, allows you to view the API requests made by the site during page loading:
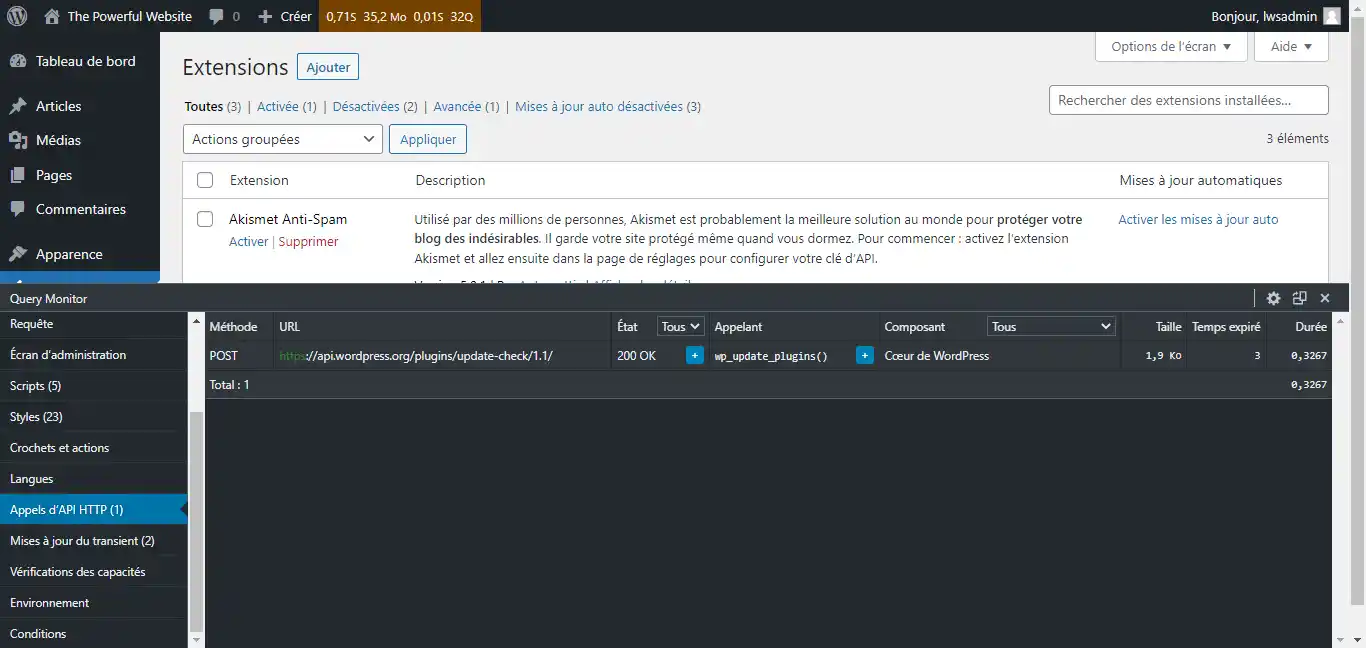
If you notice an API that responds too slowly, we recommend that you disable it by deactivating the associated plugin.
If, however, the duration is approximately rounded (such as 30.001s for example), this could mean that the API request exceeds a time limit, often due to firewall blocking. If the API accesses a resource that is not on the standard port 80 or 443, don't forget to check that the request is authorised on the cPanel server's firewall.
Now you know how to use the free Query Monitor plugin to identify the source of the slowdown problems on your WordPress website. Feel free to share your thoughts and questions in the comments section.
Rate this article :
5/5 | 1 opinion
This article was useful to you ?
Yes
No
1mn reading
How do I configure Cloudflare on a website hosted on cPanel?
3mn reading
How do you use Memcached on your cPanel website?
4mn reading
Using Redis as a persistent object cache for WordPress on cPanel
4mn reading
Speed up your site with Fastest Cache - Cache Varnish